Aerofoils » Aerodynamic forces
3.1 Aerodynamic Forces
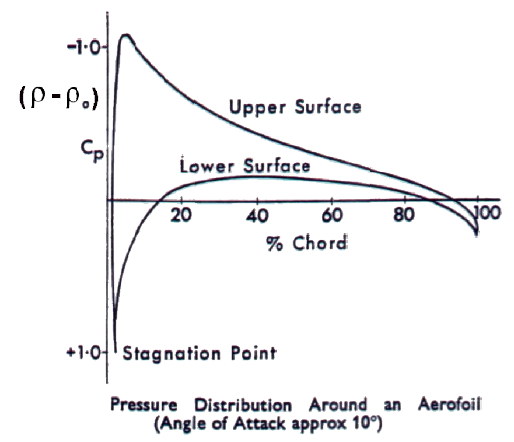
The diagrams shows a typical pressure distribution around an aerofoil. This can be determined by the wind - tunnel experiment, where the pressures acting at several points on the aerofoil can be measured using manometers. The manometer will indicate the difference in the static pressure (P) acting at a particular point and the free - stream static (Po). This difference (P - Po) at each point is plotted to give the distribution shown. The length of the arrows represent the pressure difference; the direction of the arrows represent the sense; towards the surface indicates pressure greater than static, away from the surface indicates less than static (i.e. a "suction"). Different distributions will result from different angles of attack
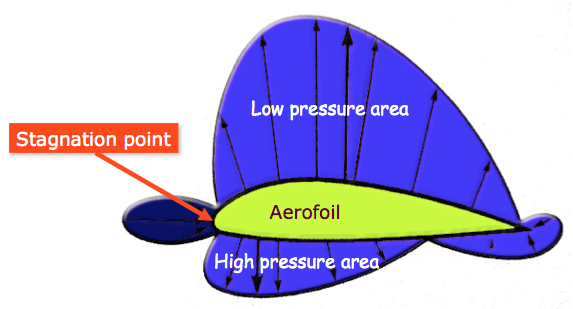
Aerodynamic forces result from the action of these aerodynamic pressures acting on the areas of the aerofoil surfaces. It is possibly clearer to understand the effect of these pressures by studying the diagram below. Based on this pressure distribution, the pressures have been plotted, using the chord line as a datum. Note that negative (suction) the two curves is proportional to the overall lifting - effect of the aerofoil.